
Top 3 Price Prediction: Bitcoin, Ethereum, Ripple on the Move
The cryptocurrency market is poised for a significant shift, with Bitcoin, Ethereum, and Ripple all showing signs of a potential breakout. In this article, we’ll delve into the technical analysis of these top three cryptocurrencies and explore what the charts are telling us.
Bitcoin Price Ready for Triangle Breakout
Bitcoin’s price has been squeezed between the trendlines of a symmetrical triangle pattern. This technical pattern has no bias, and the target is obtained by adding the triangle’s height to the breakout point. Assuming BTC triggers a bullish breakout at roughly $67,700, the height of the triangle sets the target near $73,777, its all-time high.
Bitcoin’s symmetrical triangle pattern
However, if BTC breaks the upward trendline of the triangle and closes below $67,700, the bullish thesis could be invalidated, leading to a crash of 8%, which is the technical target given by the height of the triangle, to $61,734.
Ethereum Price Looks Promising
Ethereum’s price broke above a falling wedge pattern in the 4-hour chart on May 20 and rallied 21%. However, the bearish order block from March 12, extending from $3,980 to $4,093, is rejecting ETH price.
Investors looking to buy ETH could do so at the following levels:
- At the 50% Fibonacci retracement level, drawn from the swing high of $3,984 on May 27 to the swing low of $2,864 on May 13, at $3,424.
- At the 61.8% Fibonacci retracement level of the same movement at $3,279.
If the conditions mentioned above are to play out, then the Ethereum price could revisit its previous resistance level at $4,000.
Ethereum’s Fibonacci levels
On the other hand, if Ethereum’s daily candlestick price closes below the $2,864 level, it would produce a lower low and signal a break in the market structure. This move would invalidate the aforementioned bullish thesis, potentially triggering an extra 9% crash to the previous support level of $2,600.
Ripple Price to End the Consolidation Phase
Ripple price is currently consolidating between $0.571 and $0.467 after a major 33% fall in mid-April. This 49-day consolidation has seen XRP volume weakening.
If Ripple price breaks above $0.571 and the 50% Fibonacci retracement level from the swing high of $0.744 on March 11 to the swing low of $0.419 on April 14 at $0.581, it could rally 8% to revisit the 61.8% Fibonacci retracement at $0.621.
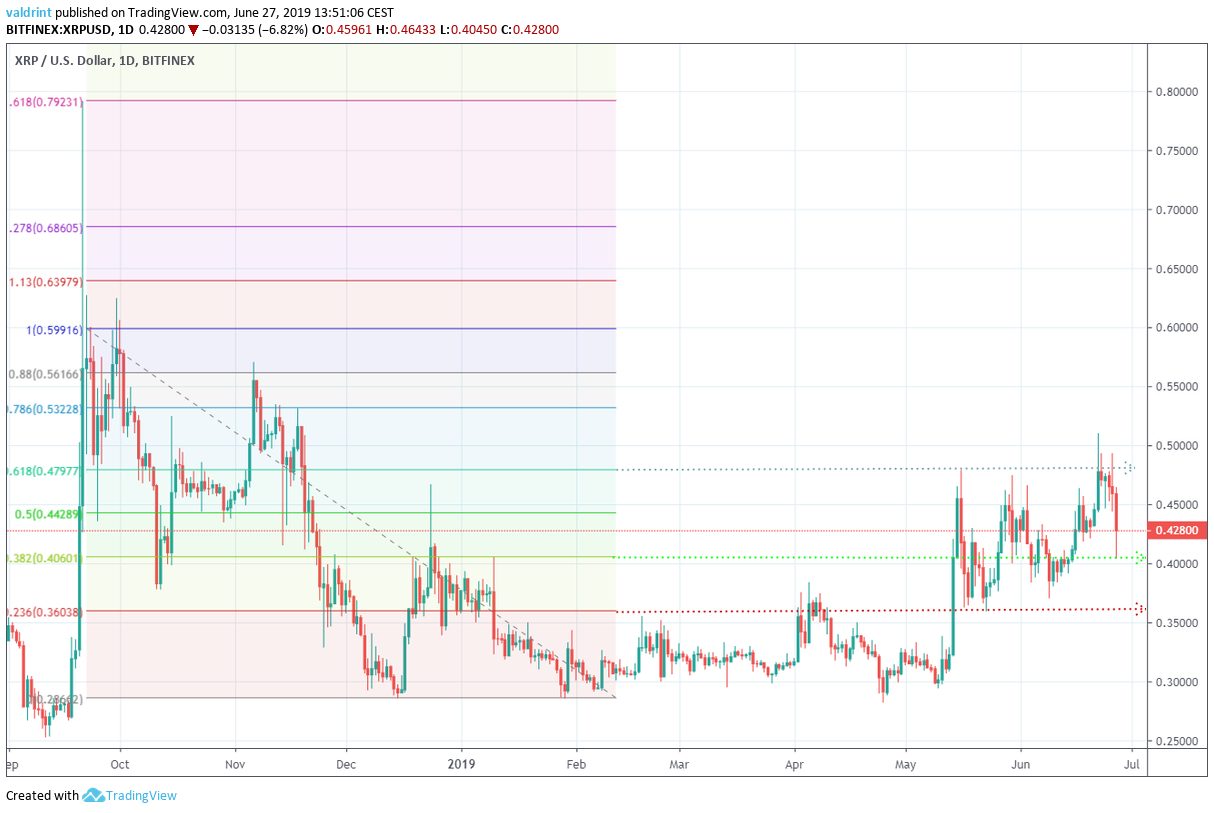 Ripple’s Fibonacci levels
However, if the Ripple daily candlestick closes below $0.467, then XRP could crash an additional 10% to its previous support at $0.419.
In conclusion, the cryptocurrency market is poised for a significant shift, with Bitcoin, Ethereum, and Ripple all showing signs of a potential breakout. As the charts continue to unfold, investors should be prepared for a wild ride.


