Photo by
 Bitcoin on Edge: Key Indicators Point Towards Market Shifts
Bitcoin (BTC) is currently testing a critical support level of $60,000, with numerous factors potentially influencing its trajectory. Recent actions by the US government, particularly regarding its seized Bitcoin assets, have contributed to a climate of uncertainty in the market.
 An illustration of Bitcoin’s fluctuating market conditions.
U.S. Government BTC Release Looms
The recent confirmation from the Supreme Court allowing the US government to sell 69,000 BTC, which was seized during the takedown of the Silk Road darknet marketplace, has raised concerns about potential oversupply. The cryptocurrency community is wary that these sales could lead to downward pressure on Bitcoin prices.
According to Arkham Intelligence, the US government holds approximately 203,239 BTC, valuing about $12.28 billion. This enormous stockpile means any decision to sell could significantly reshape market dynamics.
ETF Outflows Pressure Market
Adding to Bitcoin’s woes this October are the substantial outflows from US Bitcoin spot ETFs, recently amounting to $57.7 million. This trend is likely to affect buyer sentiment negatively. As these ETFs continue to experience net outflows, investor confidence may wane, leading to further declines in the price of Bitcoin.
On October 8 alone, outflows reached $18.6 million, exacerbating the prevailing bearish sentiment in the market. The correlation between these ETF flows and Bitcoin’s price suggests that investors should monitor this closely.
Inflation Data on the Horizon
Investors are keenly awaiting the Consumer Price Index (CPI) report set to release on October 10, which could sway both Bitcoin and the broader market. With economists predicting a slight dip in inflation from 2.5% in August to 2.3% in September, this data could either bolster or undermine confidence in BTC as a store of value.
Technical Analysis Insights
From a technical perspective, Bitcoin currently hovers just below its 50-day Exponential Moving Average (EMA) while maintaining a position above the 200-day EMA. This scenario sends mixed signals to traders. A bullish shift could occur should Bitcoin break through the $64,000 resistance, while a drop below $60,365 could trigger a bearish trend toward $57,500.
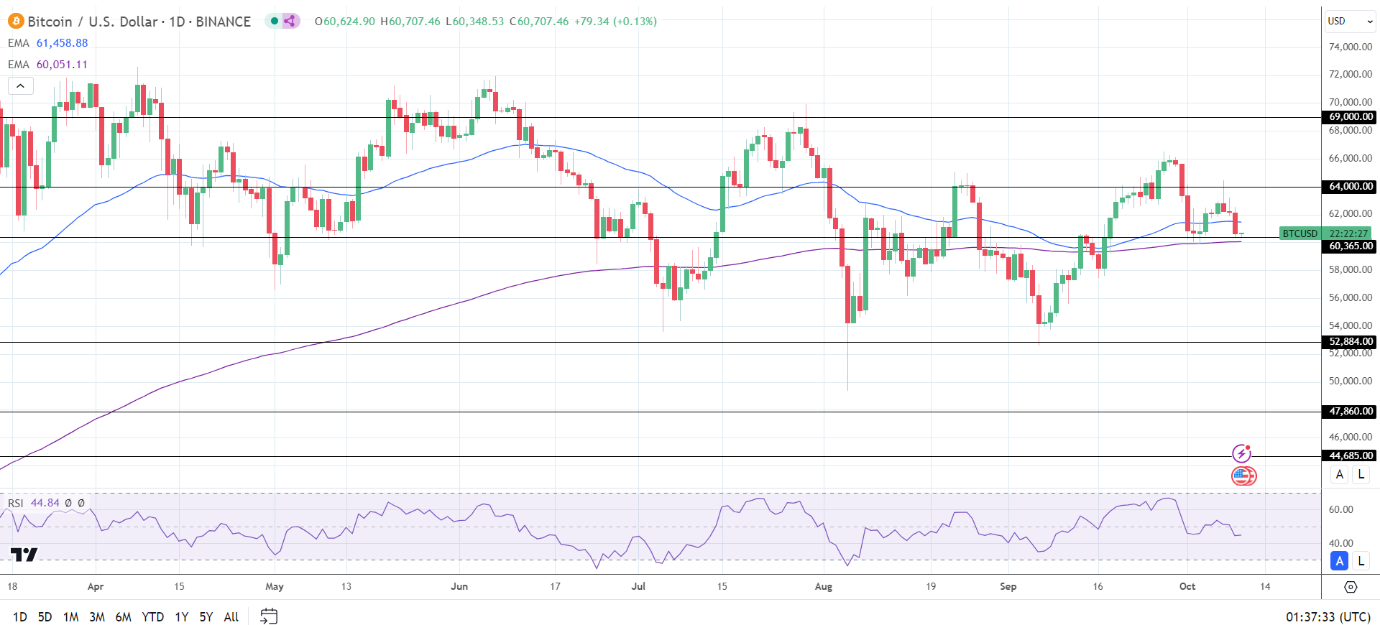 Bitcoin’s trading patterns reveal important insights into market psychology.
Ethereum’s Position in the Market
Ethereum (ETH) is also navigating turbulent waters. Currently trading below both its 50-day and 200-day EMAs, ETH faces bearish signals. Any fall through the $2,250 support could allow bears to extend their grip, targeting $2,124 next.
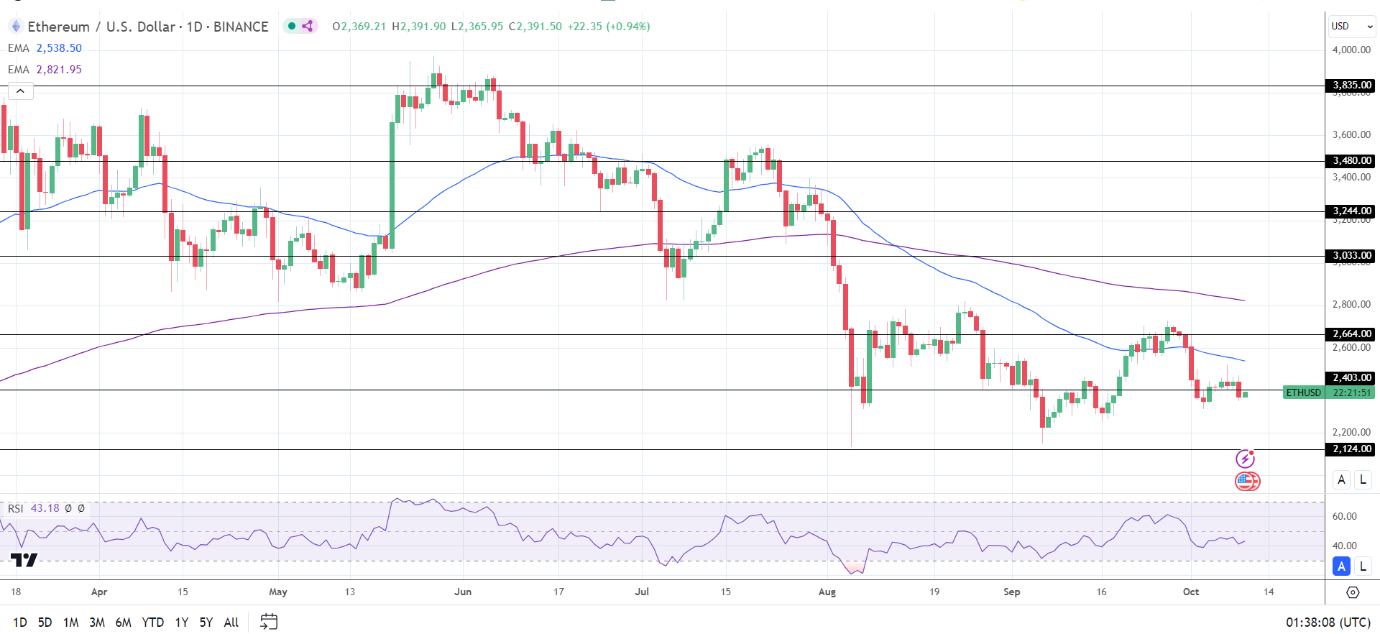 An analysis of Ethereum’s downward trends provides critical insight for investors.
Final Thoughts
Investors in Bitcoin and the broader cryptocurrency market must stay alert amidst these developments. With the potential for increased supply from government sales and the implications of ETF movement, the upcoming inflation figures will play a crucial role. Keeping a watchful eye on these indicators will be essential for anyone looking to navigate the current market landscape.
In conclusion, while Bitcoin’s long-term fundamentals remain strong, current conditions require caution and strategic planning among investors as they respond to these shifting dynamics.