
Bitcoin Breaks Free: Why the Falling Wedge Could Signal a Bullish Move
As I write this, Bitcoin is breaking above the falling wedge, signaling a potential bullish move. This development has significant implications for the entire cryptocurrency market, and I’m excited to dive into the details.
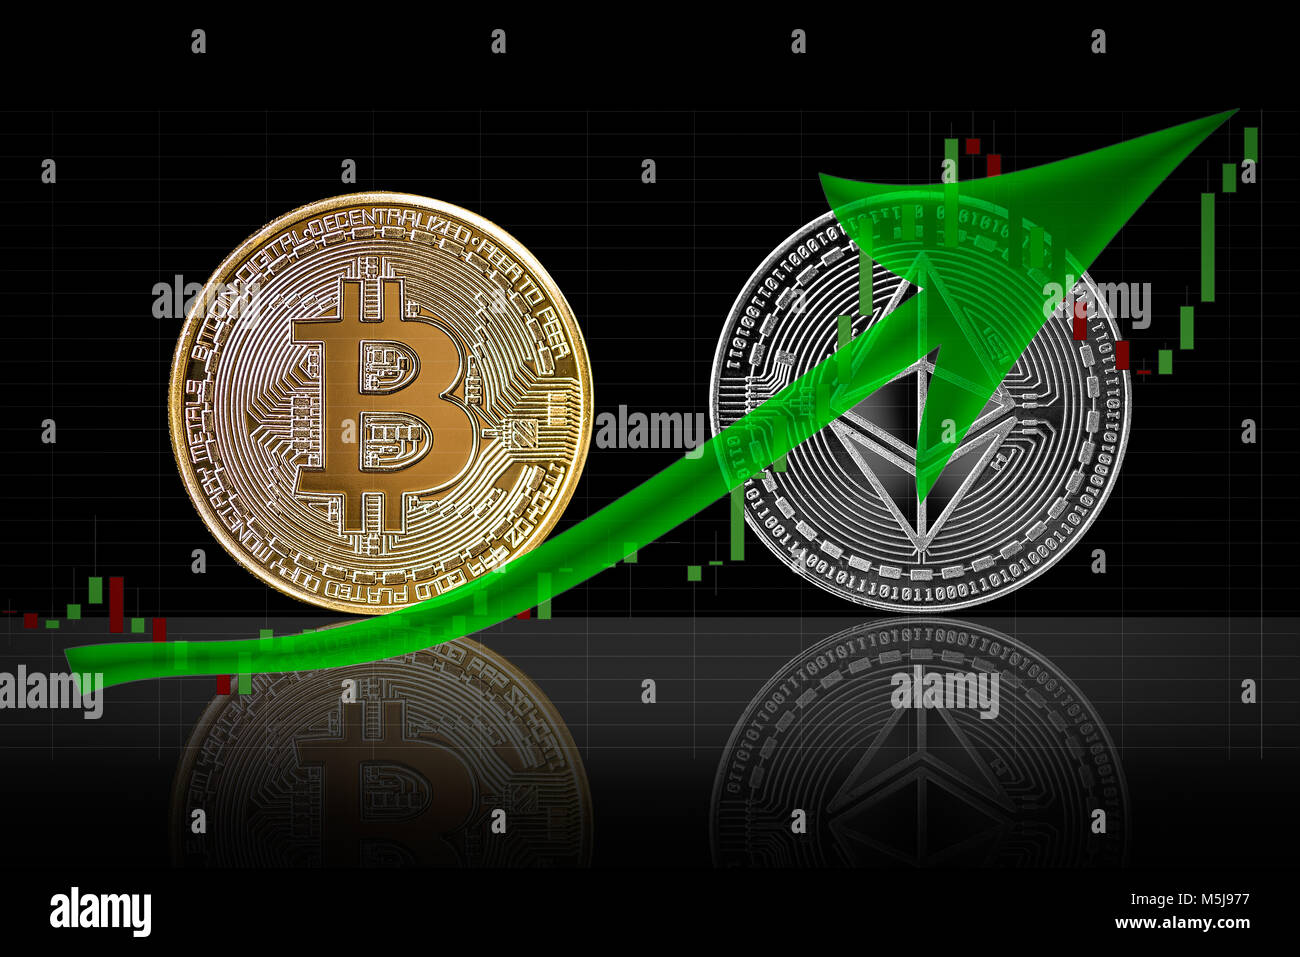
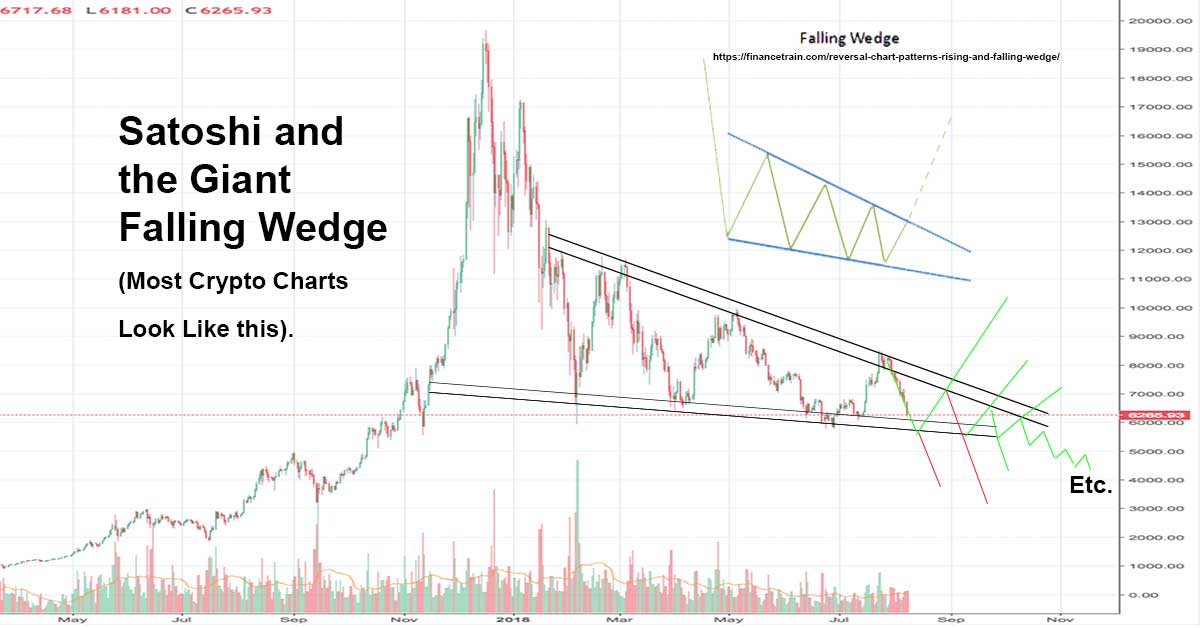 Breaking free from the falling wedge
The Bitcoin price is trading up by 1.24% at the $63,571 level, and if it closes above the $63,956 daily resistance level, it could rise 5% to retest its next weekly resistance at $67,147. The Relative Strength Index (RSI) and the Awesome Oscillator in the daily chart are below their neutral levels of 50 and zero. If bulls are indeed returning, then both momentum indicators must maintain their positions above their respective neutral levels.
“The trend is your friend until it bends.” - Unknown
If the bulls are aggressive and the overall crypto market outlook is positive, BTC could extend an additional rally of 6% to revisit its weekly resistance at $71,280. This would be a significant development, and I’ll be keeping a close eye on the charts.
Ethereum: The 61.8% Fibonacci Retracement Level Holds
Ethereum price retested its support level of $3,288, the 61.8% Fibonacci retracement level drawn from a swing low of $2,862 on May 14 to a swing high point of $3,977 on May 27 on June 24. ETH rebounded by 6.7% from the 61.8% Fibonacci retracement level and trades at around $3,501, edging up approximately 2% on Monday.
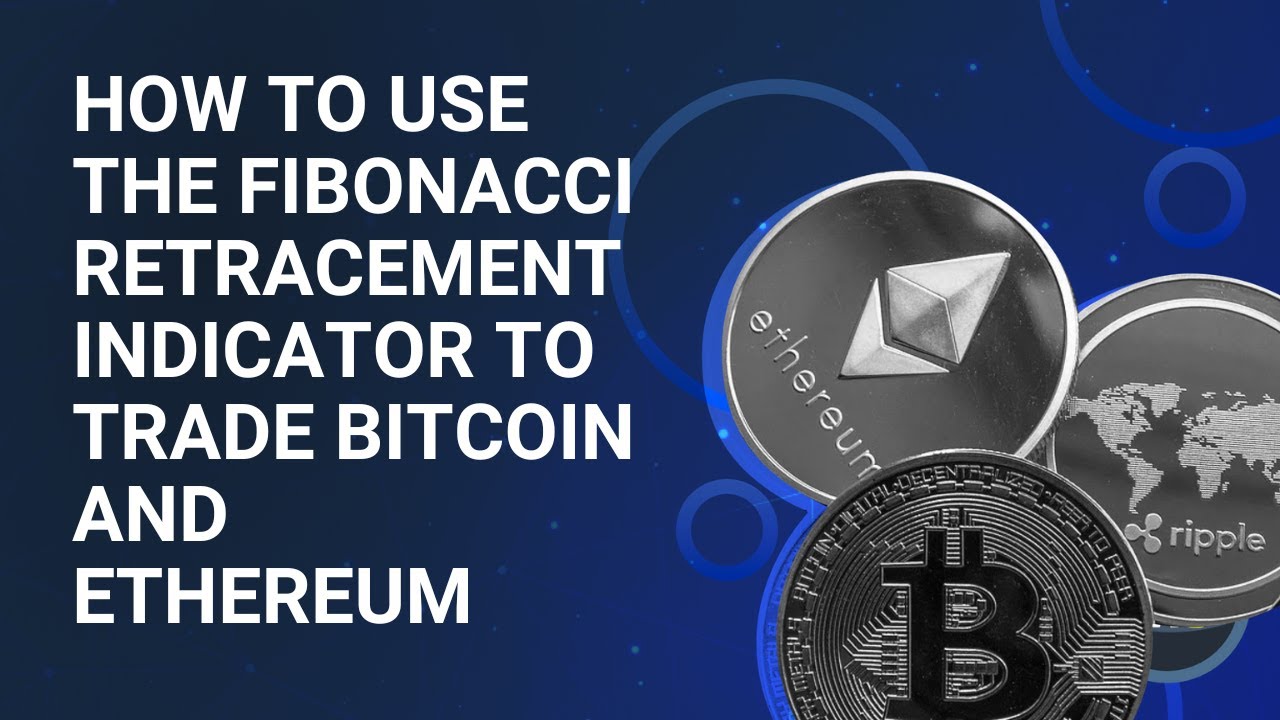 ETH finds support at the 61.8% Fibonacci retracement level
If this support at $3,288 holds, ETH price could rise 6% from its current trading level of $3,457 to tag its previous high of $3,717 on June 9. The Relative Strength Index (RSI) and the Awesome Oscillator in the daily chart are below their neutral levels of 50 and zero. If bulls are indeed returning, then both momentum indicators must maintain their positions above their respective neutral levels.
Ripple: The $0.500 Resistance Level Remains a Challenge
Ripple price currently trades at $0.478, below the daily resistance level of $0.500. If Ripple price surpasses the barrier at 0.500, it could rise 7% from $0.500 to $0.532, its previous high from June 5.
 XRP faces resistance at $0.500
In the daily chart, the Relative Strength Index (RSI) is currently below the 50 mark, indicating neutral to bearish sentiment, while the Awesome Oscillator (AO) remains below zero, suggesting bearish momentum. Both indicators must rise above their critical thresholds of 50 for RSI and zero for AO for a sustained bullish trend.
What’s Next for Bitcoin, Ethereum, and Ripple?
As the cryptocurrency market continues to evolve, it’s essential to stay informed about the latest developments. Will Bitcoin break above the $67,147 resistance level? Can Ethereum hold its support at $3,288? Will Ripple finally surpass the $0.500 resistance level? These are just a few questions on my mind as I watch the charts.
 The cryptocurrency market is full of possibilities
One thing is certain: the next few days will be crucial for Bitcoin, Ethereum, and Ripple. I’ll be keeping a close eye on the charts and will provide updates as the situation develops.


